How should I interpret the priority chart?
Two-dimensional insights requires two-dimensional visualization—Survature’s Priority Chart. In the following example, we see a mid-size company has asked their team about how the company’s workplace can improve.
Example Survey
We first asked the following question to segment the different groups of employees.
What is your primary function in this company?
( ) Sales
( ) Customer Service
( ) Support staff (accounting, payroll, back office)
( ) Management
( ) Other
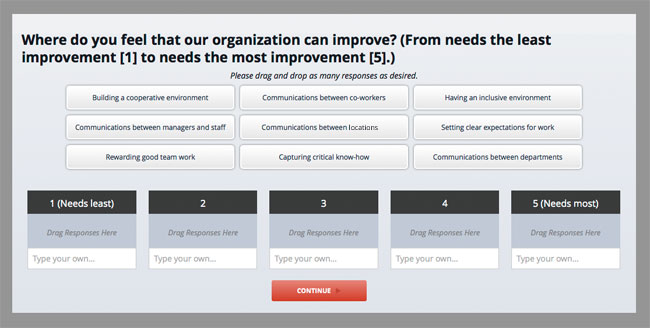
Then using Survature’s AnswerCloud we asked them the following question. In which of the following areas do you believe this company needs to make improvements? (From Needs the least improvement (1) to needs the most improvement (5).)
Analysis
The results are presented in a space of a two-by-two matrix, where the X-axis represents “Needs Improvement” and Y-axis represents Priority.
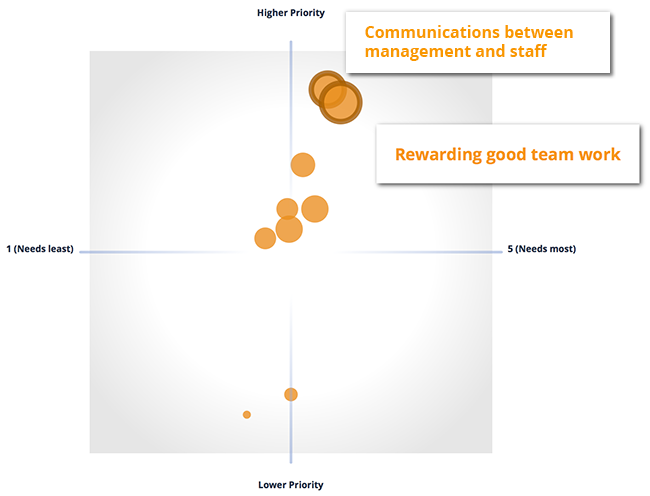
Each quadrant in the chart has specific meanings. Please consult our article on Quadrant Analysis. In this particular chart, the top right quadrant (high priority and low rating) shows the two areas needing urgent and significant improvements are: (1) communications between managers and staff; and (2) rewarding good team work.
Cross-Segment Comparison
In order to understand whether these findings held true for each employee group, we segmented and compared the results with the sales group and the customer service group. After segmenting the responses by comparing those in sales and those in customer service, we can see improving communications between management and staff in the sales group is the most important.
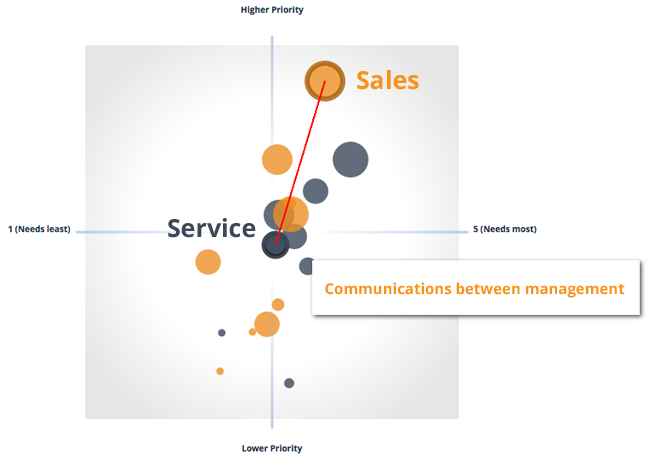
Using the Priority Chart with Segmentation, we can identify which process improvement would have the biggest positive impact among which specific group of employees within their organizations.
Sharing Priority Charts
After concluding the exploration, the analytics are shared with the management team for recommended actions. For that part, please consult the help doc for Sharing Analytics.