How can I create segments within my results?
Our surveys capture a lot of data. It isn‘t surprising that you may want to see results from respondents who answered questions in a specific way or to look at responses that were captured from a certain period of time. This is possible with our Segment Builder.
From within the Survature Segment Builder, you can define a set of rules to examine specific subsets of your respondents choices and priorities.
How to Create and Edit a Segment
Controls and the UI
The Segment Builder is comprised of the following elements:
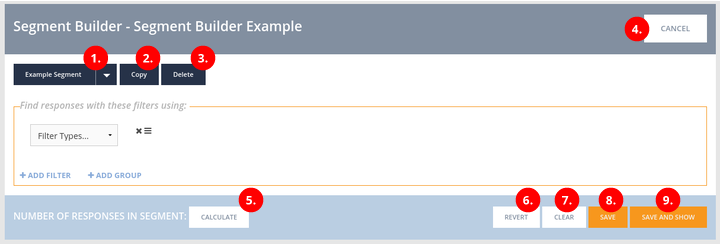
- Segment Selection – Click on the currently selected segment‘s name to rename it, or use the drop down menu to edit a different segment.
- Copy Segment – Saves your changes, and then creates a copy of the segment for you to continue working on.
- Delete Segment – Deletes the segment.
- Cancel – Discard changes and return to the survey results page.
- Calculate – When clicked, displays the number of responses that are matched by the current filters.
- Revert – Discards any changes and returns to the last saved state of this segment.
- Clear – Discards all filters, starting fresh with an empty segment.
- Save – Saves your changes so that you may continue editing the segment.
- Save and Show – Saves your changes and loads the survey‘s results page with the segment applied.
A segment is comprised of one or more filters. A filter is a condition which the response must meet in order to be included within the segment. Essentially, a filter reduces the number of respondents seen in the results page.
A group joins filters together with either logical “AND” or “OR” operations. A group may also contain nested groups within itself allowing you to create complex logic. “AND” narrows the results as you add more filters, letting you drill down deeply into your rich reserves of data. “OR” expands the number of results, letting you combine known segments together to form larger segments.
Simple Example
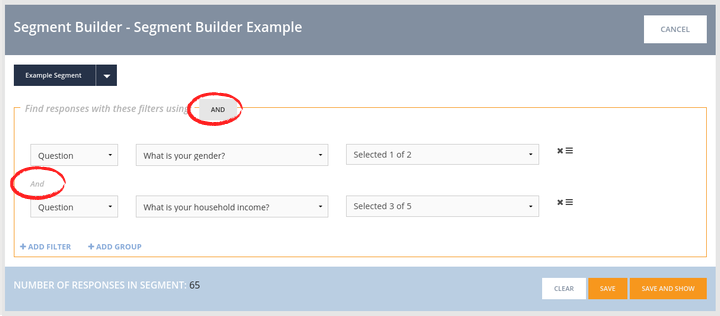
A simple example would be to create a demographic segment. In this example, the data scientist wants to see male respondents whose income fell into 3 brackets. The filter would look something like this:
Advanced Example
A more complex example would be to keep those same male responses, but also include female respondents who had an income in only one range. The filter would look more like this:
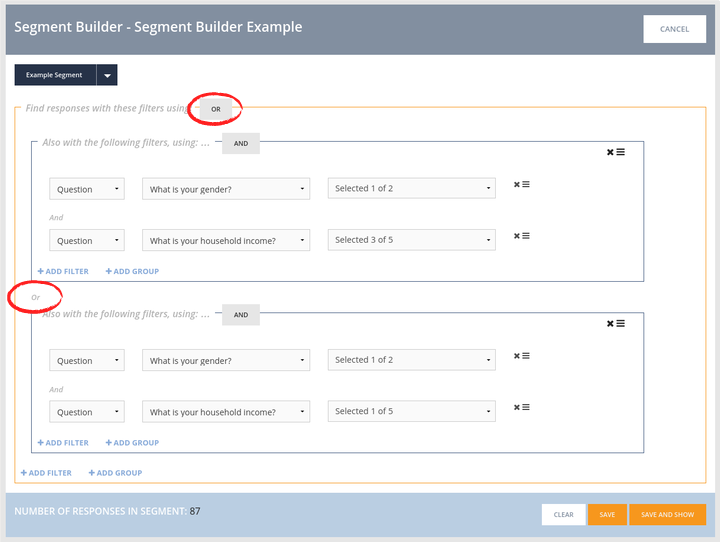
Clicks Save and Show to populate the dashboard with responses from both segments.