As soon as your survey has gone live and collected one completed response, the results page of your survey goes live too. From the results page, you have access to all of the analytical tools. No need to export data to do the analysis.
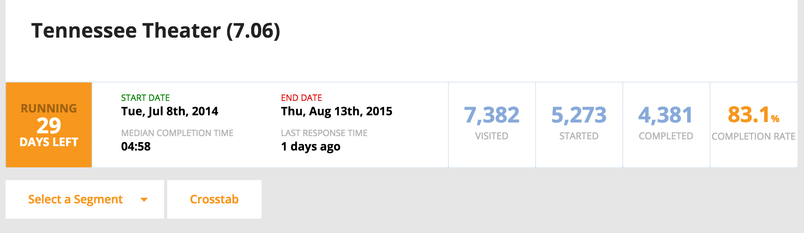
Normally, the first bits of information to look at are the operational statistics of the survey. You can see the Start Date, End Date, Mean Completion Time and Last Response Time. Visited show how many survey takers have arrived at the opening page of your survey. Started are those who clicked on the Continue button to actually start taking the survey. Completed are those that have finished the survey, i.e. seen the closing page. Completion Rate is computed by dividing Completed over Started.
You can then glance through the results page, question by question, to see whether the results confirm what you already know about your business or reveal interesting trends. Don’t worry about the average scores too early. When you have fewer than 15–20 responses, average scores can vary widely with every new survey response.
Next step is to create some segments using the Segment Builder. This of course requires that you have prepared your survey with the kind of segments that you need. Commonly used segments come in two kinds: how happy/satisfied the participants are vs. who the participants are (such as first timers or returning customers).
If you have used Data Overlays, you can also segment against the various overlay variables, which can include the customer’s actual annual purchasing amount, how often they have bought a certain product, or how long they have been your customer.
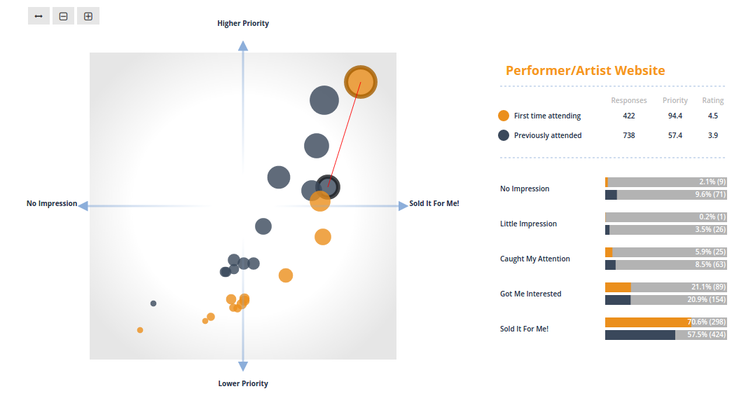
With segments, you can look at AnswerCloud question results and make direct comparisons in the priority charts, just like in this real example from our Tennessee Theatre case study.
You can also use crosstab like in this real example, also from our Tennessee Theatre case study. The table at the bottom shows residual analysis by default.
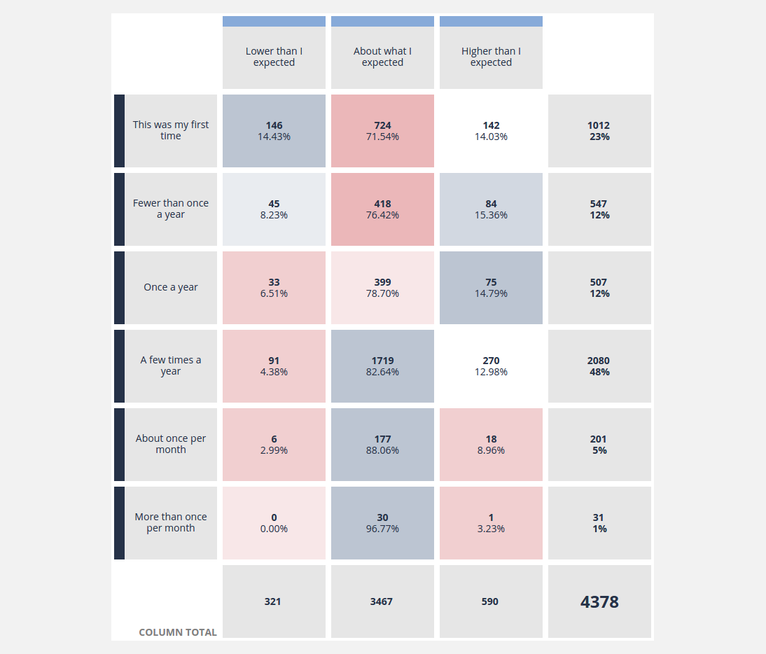
In the table, the count in each cell is a clickable link that takes you to a segmented results page, such as if you had already created a segment using two variables. For example: first-time customers that think the price is "Lower than I expected" Dashboard Link.
In addition, note that in the Row Selection and Column Selection, you can choose multiple questions, segments, or survey targets to be in the crosstab.