What is an Action Priorities Grid? #APG
Priority modeling methodology produces a lot of insights. As your data exploration goes through cross-tab, deep segmentation and priority charts, there are often many insights to derive.
To stay organized, it is important to start with an overview, proceed to discover focus and context, then, go into a deep-dive. The summary results page shows an overview of the entire survey, the cross-tab provides an overview of the survey audience, specifically, what kind of customer profiles have been captured by the survey and within each profile, who are happy, who are unhappy, who are your champions, etc.
Those two kinds of overview enables two kinds of focus. Through the summary results page, the focus is on individual aspects of your business, for example, customer experience vs. driver analysis. Through the cross-tab, the purpose is to reveal the distribution of the survey audience across many (potential) customer profiles. Since every cell in the cross-tab table is a clickable link for that deep-segment’s results page, you can build a complete profile for each customer segment that you have found to be significant. The same methodology applies externally (for customers, donors, partners) and internally (for strategy development, innovation and change management, workplace engagement etc.).
Regardless of which way, the end product of the exploration process has to be summarized, so that the findings can be shared with colleagues, executives and affect decision making. Among different ways to create the summaries, we found that the Action Priorities Grid (APG) is one of the most succinct and powerful. We even built the software to automatically create those APGs.
Example
Columns: Customer Profiles
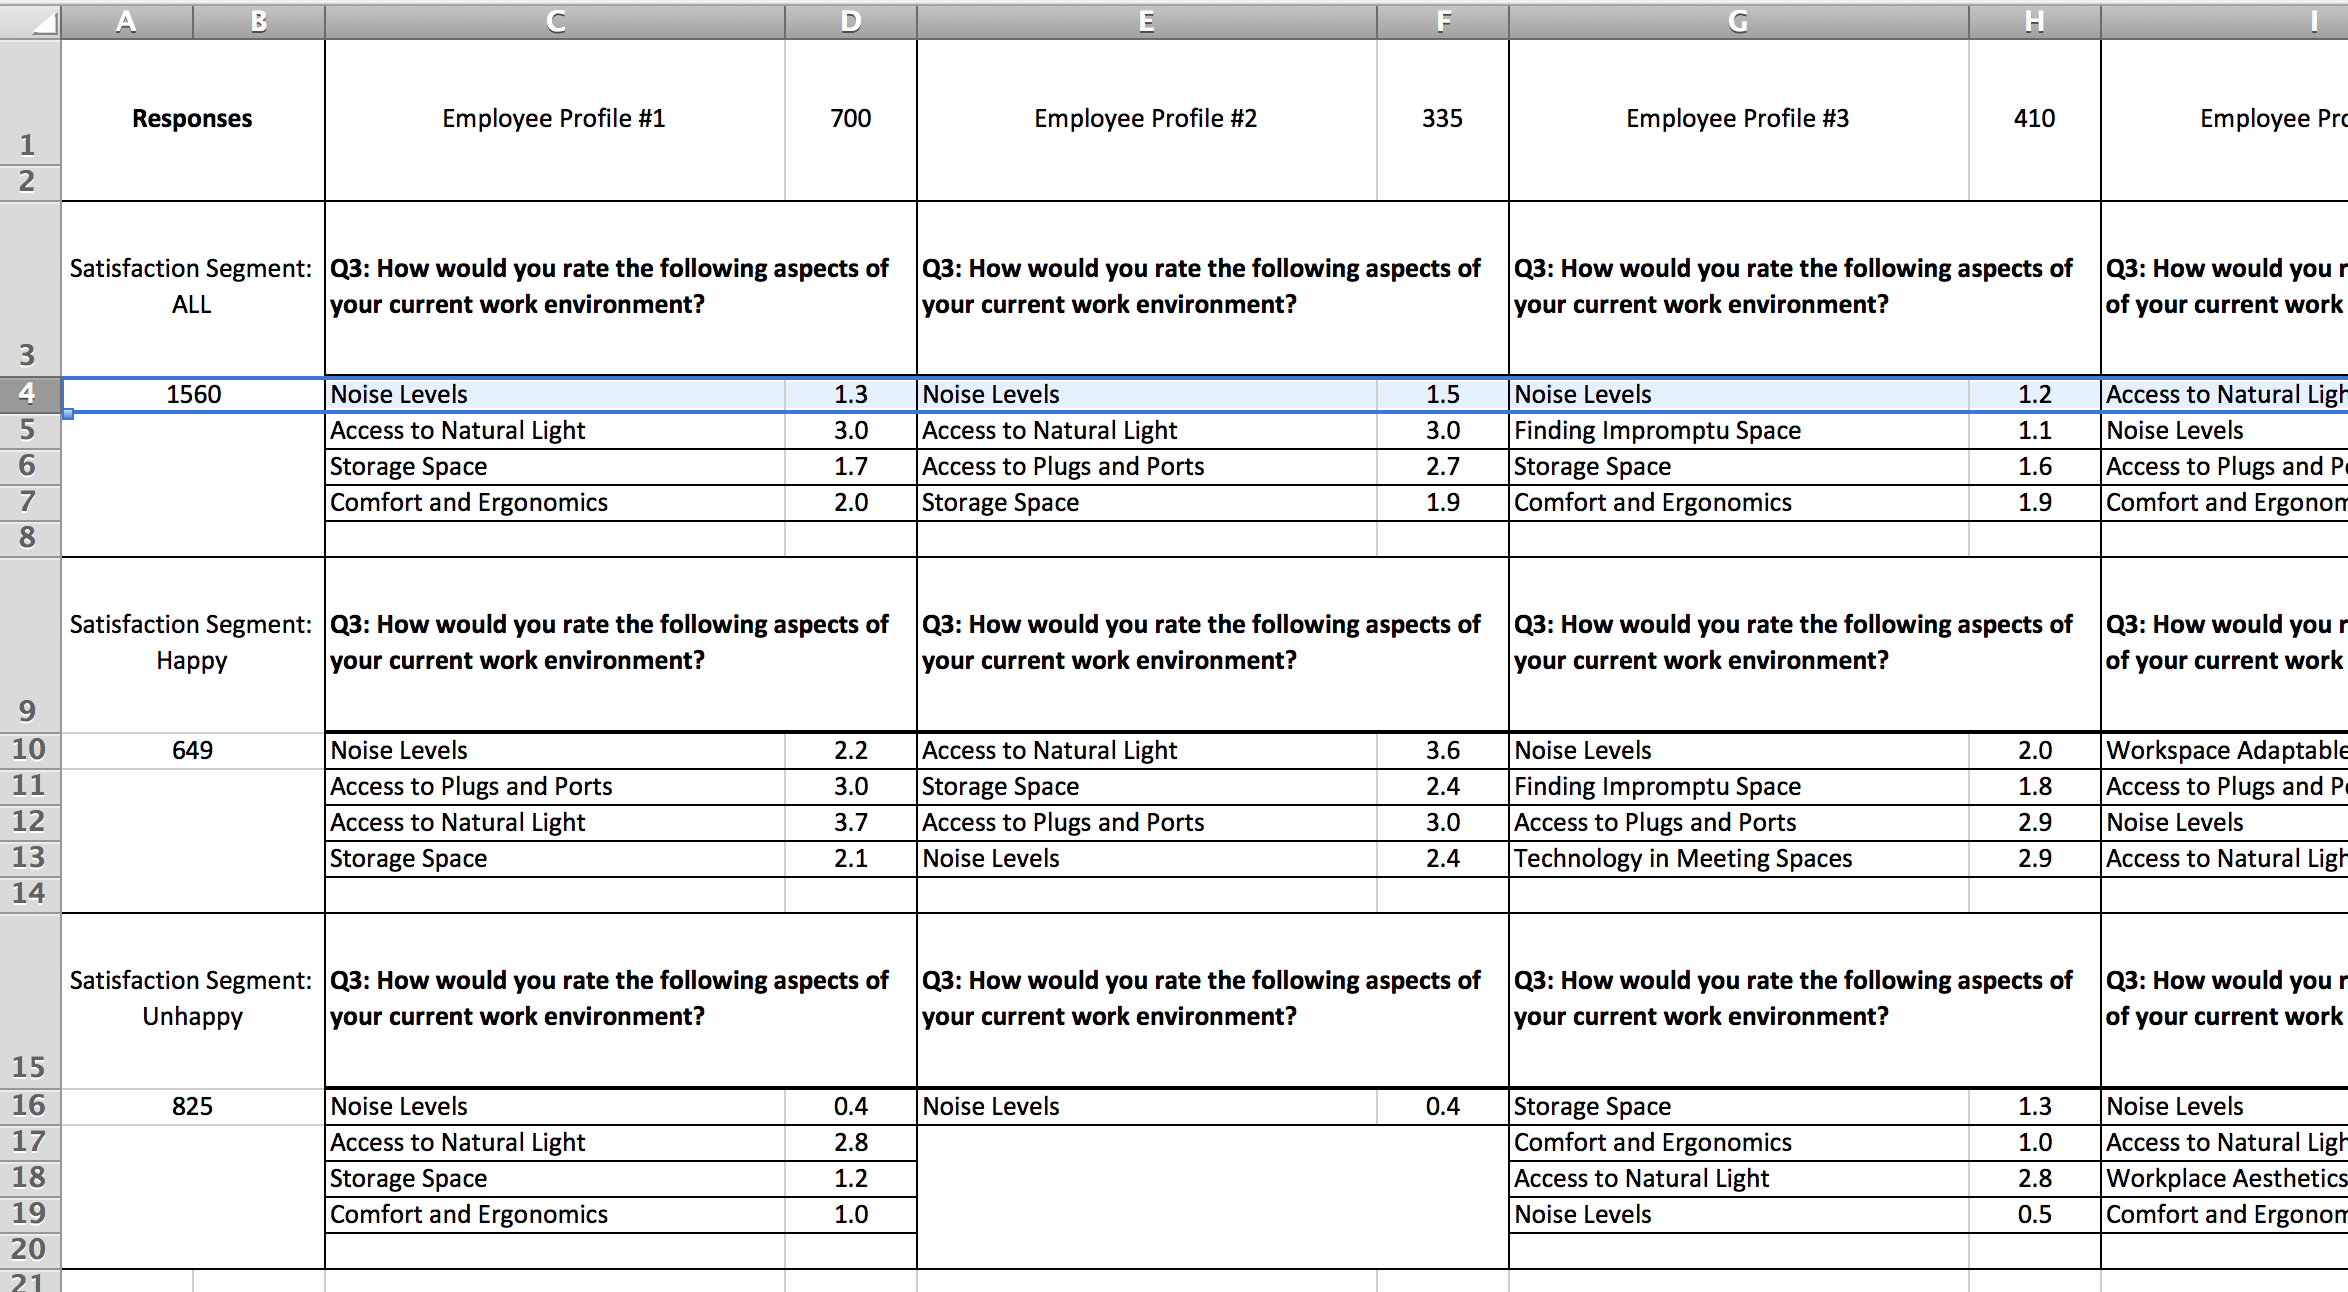
Every column in the APG is typically a profile of employee, customer, donor, or any segment of your respondents. You can have 3-5 or 15-20 different profiles and more. In Survature’s results analytics, these profiles can be defined as segments, which you can create manually or create via the deep segmentation feature in the cross-tab; or these profiles can be based on survey targets. Overall it’s quite flexible.
In this example, we generically call these profiles #1, #2, #3, etc. The numbers 700, 335, 410 are counts of how many responses belong to each profile.
Rows: Secondary Segments within the Profiles
On the rows, you typically will apply a secondary stratification in your data, for example, to dissect by level of satisfaction, engagement, job function, or even employment length. The choice is yours. In the Survature analytics dashboard, these are fully customizable segments or targets (exactly the same set of options as in columns).
In this example, we generically list these as satisfaction segment (ALL: meaning everybody, Happy: only the happy employees, Unhappy: only the unhappy employees).
Cells: Context-Specific Action Priorities
In reference of the column and row, the cells each list the top priorities only. The AnswerCloud question chosen is show in the cell for user convenience. For example, cells C4-C8 show the top 4 items by priority and D4-D8 show the satisfaction ratings for each item on a 5-point scale. C4:D8 are for Employee Profile #1 (all satisfaction levels).
The highlighted row shows that “Noise Levels” is the number one priority across almost all employee profiles. So if you were to design a new workplace, that’s obviously a current pain point to address. You can see many other patterns. For example, “Finding impromptu space” is among the top priorities for Employee Profile #3 (cell G5) but not for other Employee Profiles. For the unhappy employees in Employee Profile #2, there is only one priority - “Noise Levels” and that score is only 0.4 (F16), which requires that you improve that urgently and significantly.
Multiple AnswerCloud Questions
When the analytics software produces APGs for you, each APG is for one AnswerCloud question. So if your survey has 5 AnswerClouds, then you will receive 5 APGs, each in a separate spreadsheet. However, because the customer or employee profiles you specify are the same, if you feel appropriate, you can customize by copy & pasting the spreadsheets together. A common use for this is to shorten a presentation or to tell a more complete story to colleagues and executives.
Potential Caveats
When you design your surveys, you will of course already have a lot of hypotheses about how you’ll profile your survey audience. The biggest caveat can be that some profiles have too few data points to be reliable, while some other profiles lack specificity because they have too large a portion of the audience included in the segment. Both of these situations should be avoided. There are other potential issues of similar kinds.
We summarize these issues overall as “over analyzing” or “under analyzing”. Having more experience with data analytics will help in this regard. To help ensure the highest quality of data analytics, you’ll need to contact our user support for APGs. The automatic generation of APGs can start as soon as your survey receives its first responses, and you can specify the specific profiles to be built at the onset of your survey launch. Given that normal surveys stay open for up to two-weeks, there is enough time for us to help you become comfortable with the APG process. As soon as your survey closes, you’ll be able to share the final APGs with your team, which helps to accelerate the decision making process.
Exporting APG
Note: Before you can export an Action Priorities Grid for your survey, you must have already built segments of your respondents using the Segment Builder or from a Crosstab cell.
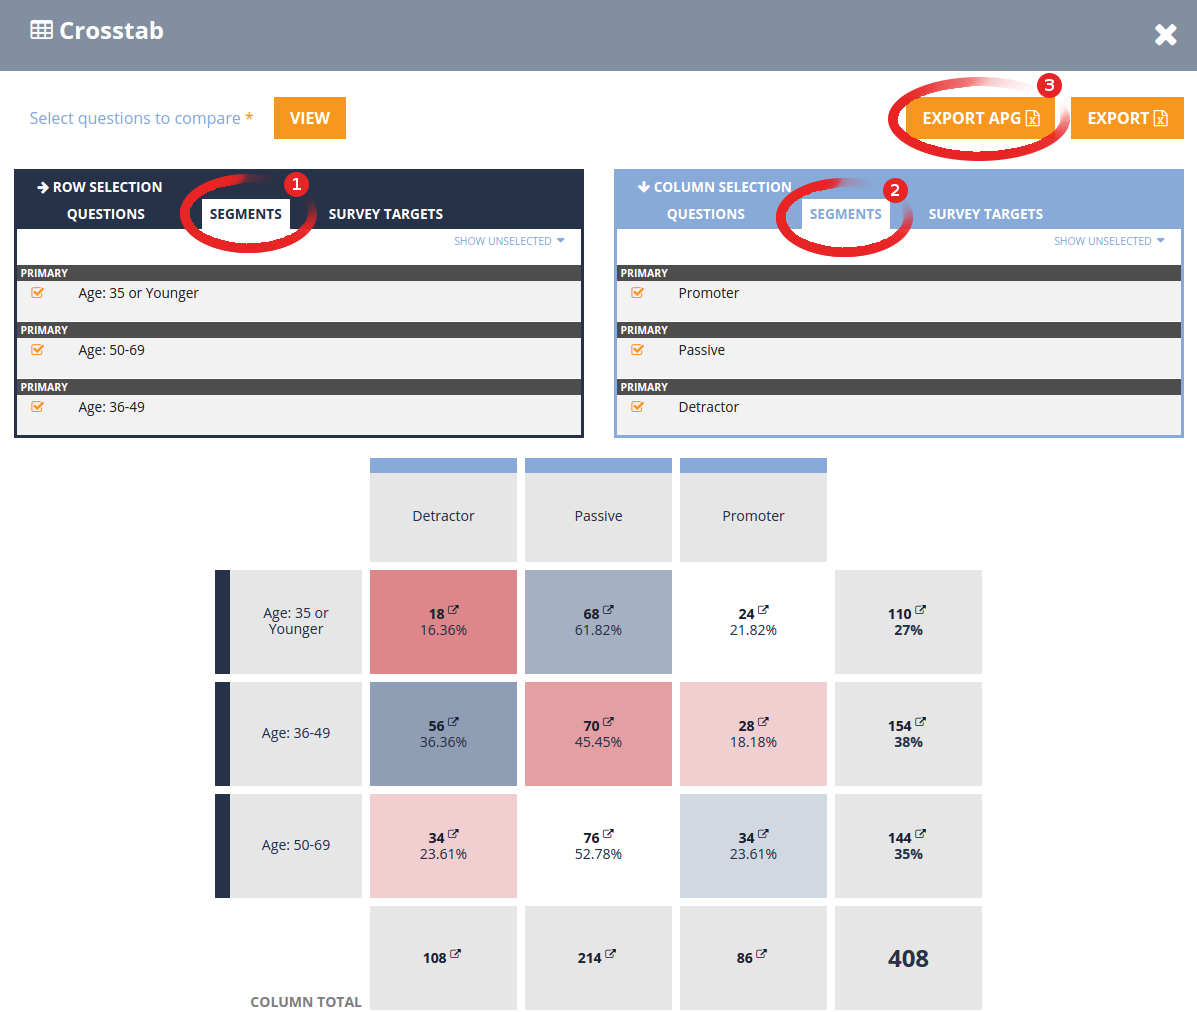
Action Priorities Grids are exported via the Crosstab, but the export button is hidden by default. To make the export button appear, you must first do the following:
- Select Segments to use for the rows of the Crosstab. These will be your secondary segments within the APG.
- Select Segments to use for the columns of the Crosstab. These will be your customer profiles.
- After clicking the “VIEW” button, the APG export button will appear. From here, select the AnswerCloud question you wish to layer within the APG.
And that’s it! Your APG will download as an Excel spreadsheet.